Updates
Recently updated content
 North Pacific (NP) Index by Trenberth and Hurrell; monthly and winter
Years of record
- to
The North Pacific Index (NP index or NPI) is the area-weighted sea level pressure over the region 30°N-65°N, 160°E-140°W. The NP index is defined to measure interannual to decadal variations in the atmospheric circulation. The dominant atmosphere-ocean relation in the…
-
Formats
- ascii
-
Timestep
- Monthly, Seasonal
-
Collections
- Climate Analysis Section (CAS) Data Catalog
Experts contributing reviews
- Hurrell, James, Phillips, Adam
 Southern Oscillation Indices: Signal, Noise and Tahiti/Darwin SLP (SOI)
Years of record
- to
The Southern Oscillation Index (SOI) is a time series used to characterize the large scale sea level pressure (SLP) patterns in the tropical Pacific. Monthly mean SLP at Tahiti [T] and Darwin [D] are used. An optimal SOI can be constructed. It consists of [T-D] which…
-
Timestep
- Monthly
-
Domain
- Australia, Pacific Ocean, Tropics
-
Collections
- Climate Analysis Section (CAS) Data Catalog
Experts contributing reviews
- Trenberth, Kevin
 Hurrell wintertime SLP-based Northern Annular Mode (NAM) Index
Years of record
- to
The NAM (or Arctic Oscillation) is defined as the first EOF of NH (20°-90°N) winter SLP data. It explains 23% of the extended winter mean (December-March) variance, and it is clearly dominated by the NAO structure in the Atlantic sector. Although there are some subtle…
-
Formats
- ascii
-
Timestep
- Seasonal
-
Collections
Experts contributing reviews
- Phillips, Adam
 Hurrell North Atlantic Oscillation (NAO) Index (PC-based)
Years of record
- to
The principal component (PC)-based indices of the North Atlantic Oscillation (NAO) are the time series of the leading Empirical Orthogonal Function (EOF) of SLP anomalies over the Atlantic sector, 20°-80°N, 90°W-40°E. These indices are used to measure the NAO…
-
Formats
- ascii
-
Timestep
- Monthly, Seasonal, Annual
-
Domain
- Atlantic Ocean
-
Collections
- Climate Analysis Section (CAS) Data Catalog
Experts contributing reviews
- Hurrell, James, Phillips, Adam
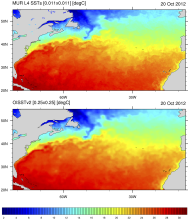 SST Data Sets: Overview & Comparison Table
Years of record
- to
Sea surface temperature (SST) data sets are an essential resource for monitoring and understanding climate variability and long-term trends. By surface area, SSTs are the dominant (~71%) input into merged global land-ocean surface temperature data products. Historically,…
-
Formats
-
Timestep
- Climatology, Daily, Monthly, Weekly
-
Domain
- Global
-
Collections
- Overview / Comparison page
Experts contributing reviews
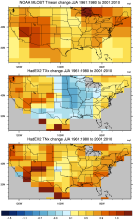 HadEX2: Gridded Temperature and Precipitation Climate Extremes Indices (CLIMDEX data)
Years of record
- to
Note: HadEX2 has been superseded by HadEX3. HadEX2 provides gridded, station-based indices of temperature- and precipitation- related climate extremes. It is intended for detection and attribution studies and climate model evaluation. Twenty-nine indices, including daily…
Main variables and Earth System components
Atmosphere Maximum Air Temperature Minimum Air Temperature Land Freeze/ThawExperts contributing reviews
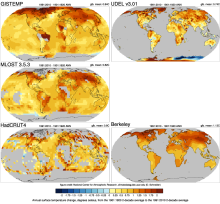 Global Temperature Data Sets: Overview & Comparison Table
Years of record
- to
Global surface temperature data sets are an essential resource for monitoring and understanding climate variability and long-term trends. The most commonly used data sets combine historical observations of near surface air temperatures at land stations with global data…
Main variables and Earth System components
Atmosphere Air Temperature Air Temperature at 2m Ocean SST - sea surface temperature-
Timestep
- Climatology, Monthly
-
Domain
- Global
-
Collections
- Overview / Comparison page
Experts contributing reviews
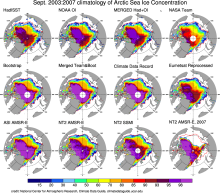 Sea Ice Concentration data: Overview, Comparison table and graphs
Years of record
Sea ice concentration is both an indicator and driver of changes high-latitude climate with strong societal and ecological importance. It is a key boundary condition for atmospheric models (including those used in atmospheric reanalyses) and a benchmark for coupled climate…
-
Formats
-
Timestep
-
Collections
- Overview / Comparison page
Experts contributing reviews
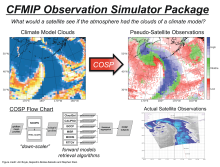 COSP: Cloud Feedback Model Intercomparison Project (CFMIP) Observation Simulator Package
Years of record
Cloud processes and feedbacks are recognized as the largest uncertainty in climate model projections. Progress in understanding the roles of clouds in the response of the Earth to changes in external forcing (GHG, aerosoles, etc.) has in part been hampered by the lack of a…
-
Formats
-
Timestep
-
Domain
- Global
-
Collections
- Diagnostic Data Sets, NCAR-DOE-CESM, atmosdiagnostics
Experts contributing reviews
- Kay, Jennifer
 GHCNDEX: Gridded Temperature and Precipitation Climate Extremes Indices (CLIMDEX data)
Years of record
- to
GHCNDEX provides gridded, station-based indices of temperature- and precipitation- related climate extremes. It is intended for detection and attribution studies, climate model evaluation, and operational monitoring of extreme climatic events. Twenty-six indices, including…
Main variables and Earth System components
Atmosphere Maximum Air Temperature Minimum Air Temperature Land Freeze/ThawExperts contributing reviews